About Me

I am an aspiring sales representative who has always loved working with computers and technology as a whole. Learning about data analysis and the power of certain programs such as Tableau, R Studio and others has opened opportunities regarding research that I never thought about. Now, I cannot get my hands off these tools, as I am continuously trying to learn and express my knowledge.
I graduated in May 2022 from the University of Richmond with a Bachelors in Communications. In May of 2023, I graduated with a graduate degree in Data Analytics. Whilst my time at Richmond, I have had the amazing opportunity to play Division I baseball as well. This has allowed me to grow my communication skills with teammates and coaches, as well as develop routines and schedules to improve my play. Being able to play this game has made me embrace the work that needs to be put in to be successful, which has shown on the field as well. Now, I am eager to transfer this hard work into the real world through my career.
Projects
COVID-19 Dashboard
In this project, I looked at different variables from the COVID-19 virus, and how they affected populations around the world. With the power of SQL and Tableau, I was able clean the data using simple and complex queries using SQL language, and then export my findings into a concise but informative dashboard.
In this dashboard, you can track multiple different aspects of COVID-19, such as the percentage of the population that was affected in each country, with projections for the future as well. This project definitely show insight to COVID-19, and the threats it could have on the world.
Tableau Story - Land Values in Richmond, VA
In this project, I researched datasets from the Richmond Government Database and selected the Property Assessment History dataset of Richmond, VA. Within this dataset, I was able to create insights from several different variables, including the land value of certain locations within the city, and how they have changed over time. With the power of Tableau, I was able to create a telling data story that gives interesting visuals into how Richmond has grown as a city.
ArcGIS Story Map
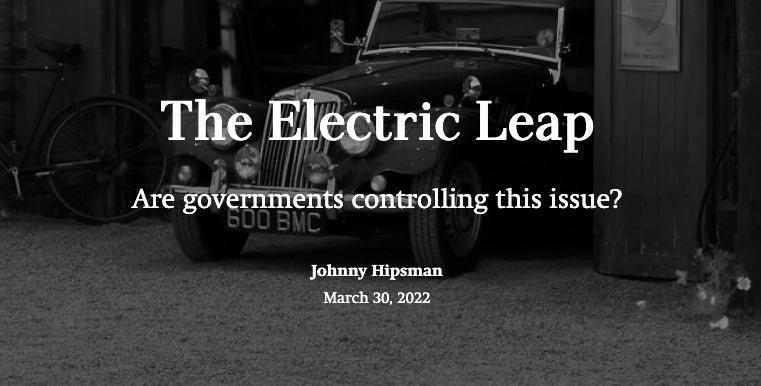
In this project, I brainstormed a pressing issue that is affecting our world today in which I could analyze its rhetoric. The adoption of electric vehicles throughout the world is growing at a exponential rate, which is why I chose it for this project. While researching, I took a step back and looked at the big picture of why electric vehicles are in such high demand right now, and that is because of climate change.
This ArcGIS StoryMap guides the reader through the specific rhetorics of this topic, and why illustrators and authors made certain stylistic choices. For instance, there are key details that are left off of some of the illustrations and maps of this StoryMap, also known as "silences". These play a huge part in the reader's consumption of the material and perception on the topic itself.
Check out the StoryMap here.
Resume
Resume
Contact
Phone
(845)-467-0619
E-Mail
johnnyhipsman@gmail.com
Elements
Text
This is bold and this is strong. This is italic and this is emphasized.
This is superscript text and this is subscript text.
This is underlined and this is code: for (;;) { ... }. Finally, this is a link.
Heading Level 2
Heading Level 3
Heading Level 4
Heading Level 5
Heading Level 6
Blockquote
Fringilla nisl. Donec accumsan interdum nisi, quis tincidunt felis sagittis eget tempus euismod. Vestibulum ante ipsum primis in faucibus vestibulum. Blandit adipiscing eu felis iaculis volutpat ac adipiscing accumsan faucibus. Vestibulum ante ipsum primis in faucibus lorem ipsum dolor sit amet nullam adipiscing eu felis.
Preformatted
i = 0;

while (!deck.isInOrder()) {
    print 'Iteration ' + i;
    deck.shuffle();
    i++;
}

print 'It took ' + i + ' iterations to sort the deck.';
Lists
Unordered
- Dolor pulvinar etiam.
- Sagittis adipiscing.
- Felis enim feugiat.
Alternate
- Dolor pulvinar etiam.
- Sagittis adipiscing.
- Felis enim feugiat.
Ordered
- Dolor pulvinar etiam.
- Etiam vel felis viverra.
- Felis enim feugiat.
- Dolor pulvinar etiam.
- Etiam vel felis lorem.
- Felis enim et feugiat.
Icons
Actions
Table
Default
| Name |
Description |
Price |
| Item One |
Ante turpis integer aliquet porttitor. |
29.99 |
| Item Two |
Vis ac commodo adipiscing arcu aliquet. |
19.99 |
| Item Three |
Morbi faucibus arcu accumsan lorem. |
29.99 |
| Item Four |
Vitae integer tempus condimentum. |
19.99 |
| Item Five |
Ante turpis integer aliquet porttitor. |
29.99 |
|
100.00 |
Alternate
| Name |
Description |
Price |
| Item One |
Ante turpis integer aliquet porttitor. |
29.99 |
| Item Two |
Vis ac commodo adipiscing arcu aliquet. |
19.99 |
| Item Three |
Morbi faucibus arcu accumsan lorem. |
29.99 |
| Item Four |
Vitae integer tempus condimentum. |
19.99 |
| Item Five |
Ante turpis integer aliquet porttitor. |
29.99 |
|
100.00 |

